In 2025, end-of-life (EOL) risk for electronic components has become one of the biggest challenges for the supply chain. According to industry data, more than 328,000 EOL notices were issued globally in 2023, and this number is expected to continue to rise in 2025 (driven by AI/automotive demand pushing suppliers to optimize their product lines). EOL can lead to production disruptions, skyrocketing redesign costs (averaging $100,000-$500,000 per project), and even product withdrawal from the market.
This article, originally written by the supply chain expert team at AMPLE CHIP LIMITED , helps electronics engineers and OEM/ODM purchasing personnel proactively manage risks. Through strategies such as reusing surplus inventory, you can reduce costs by 20-40%, extend product lifecycles, and avoid the risk of counterfeit parts.
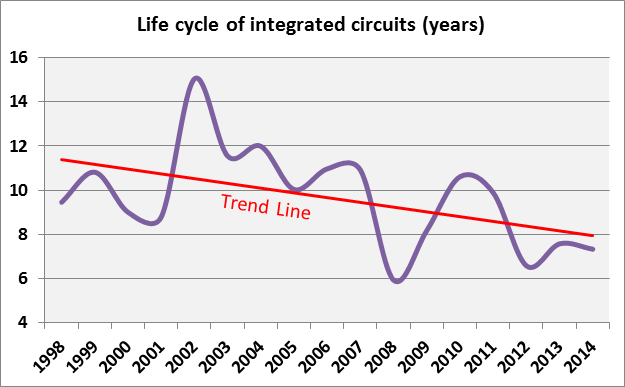
The chart above shows the typical lifecycle curve of an electronic component (from introduction to end-of-life/EOL).

Above: Schematic diagram of component lifecycle stages
1. Current Status and Causes of EOL Risks (Latest Insights as of 2025)
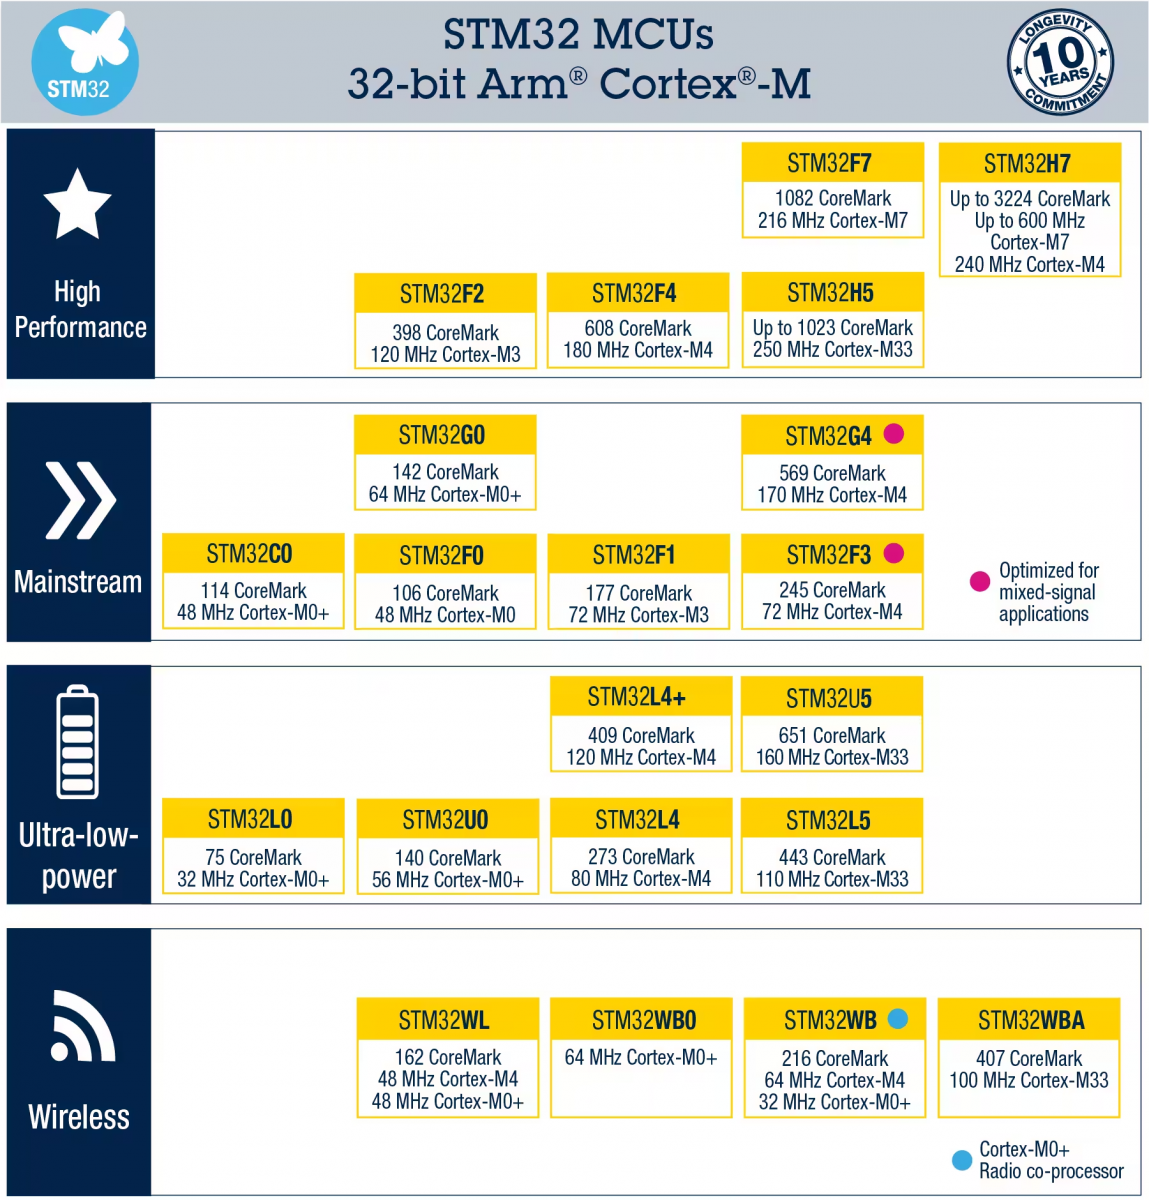
- Statistics show that in 2025, there will be an increase in EOL (End of Service) notices, with older logic ICs (such as the 74HC series), 8-bit MCUs (such as the PIC16), and analog devices (such as the ADXL335 accelerometer) frequently entering the EOL stage.
- Main causes :
- Technological iteration: Suppliers are focusing on new AI/automotive-grade products and abandoning mature, low-profit parts.
- Supply chain adjustments: Geopolitical risks and cost pressures lead to "immediate production stoppages" (no traditional LTB opportunities).
- Shifting market demand: The conflict between the short lifecycle of consumer electronics and the long lifecycle of industrial/automotive products.
- Risk impact : End-of-life (EOL) of single-source parts can lead to production line shutdowns; the risk of counterfeit parts increases (the black market proliferates after EOL).
2. EOL Risk Management Flowchart (Recommended Standard Flowchart)

A flowchart showing the end-of-life ( EoL ) pathways for the battery... | Download Scientific Diagram
Above: Flowchart of the EOL (End-of-Life) Decision-Making Process for Electronic Products

Typical decision making process at the end-of-life of an electronic... | Download Scientific Diagram
Above: Typical EOL risk assessment process
Core steps :
- Monitor PCN/PDN : Subscribe to manufacturer notifications ( tools such as Microchip/ SiliconExpert ).
- Lifecycle assessment : Using databases to predict end-of-life (EOL) risk.
- Risk classification : High (single source/critical), Medium (multiple sources), Low (standard parts).
- Mitigation strategy options : LTB, substitution, inventory buffer, redesign.
- Implementation and Tracking : BOM Update + Supplier Audit.
3. Practical Mitigation Strategies (Applicable to Engineers/Purchasing)
Use the following table to evaluate common strategies:
|
Strategy |
Applicable Scenarios |
advantage |
shortcoming |
Cost estimation (2025) |
Recommended tools/platforms |
|---|---|---|---|---|---|
|
Last Time Buy (LTB) |
High-risk critical components, products with long lifecycles |
Ensure supply buffer |
Inventory ties up capital and represents potential waste. |
Medium (bulk purchase discount) |
Platform warehousing services |
|
Second Sourcing |
Design phase |
Reduce single-source risk |
Compatibility needs to be verified. |
Low (early planning) |
Octopart / SiliconExpert |
|
Reuse of surplus inventory |
NRND/EOL parts |
Costs 30-50% lower, quick to use |
Quality verification required (date code/counterfeit). |
lowest |
AmpleChip BOM Matching |
|
Inventory Buffer |
Medium-risk items |
Bridging transition period |
Capital occupation |
medium |
ERP system + platform warehousing |
|
Redesign |
Long-term products |
Completely solve |
High time/cost (long verification cycle) |
high |
Altium and other EDA tools |
Case study of the advantages of surplus inventory : In 2025, an OEM replaced STM32F0 series with surplus inventory, saving 25% of costs and avoiding a 6-month delivery delay.

Sell Your Excess Electronic Components | AGS Devices
Above: Example of EOL (Employment Inventory) sourcing
4. Example of an obsolete BOM management form

BOM Obsolescence Service - AMSYS
Above: Example of a Bill of Materials (BOM) obsolescence risk report (CPN level)

BOM Management: A Data-Driven Approach to MRO Excellence
Above: Example of a BOM management table
Recommended practice :
- Regular (quarterly) audit of BOM: mark NRND/EOL parts.
- Use tools to automatically trigger alerts ( SiliconExpert , Z2Data).
- Prioritize new, unused remaining inventory: reliable quality and complete compliance certifications.
5. Recommended Tools and Platforms for 2025
- Free/Low Cost : Octopart (market data), Manufacturer PCN subscription.
- Specialty : SiliconExpert (Lifecycle Prediction).
- Platform Solution : AmpleChip – AI BOM Matching + Remaining Inventory Priority Recommendation + Sustainable Reporting.
Conclusions and Calls to Action
EOL (End-of-Life) risks are unavoidable, but proactive management can turn them into advantages: cost optimization + supply chain resilience. By 2025, excess inventory will become the mainstream mitigation solution.
Take action now : Upload your BOM to AmpleChip and get a free EOL risk assessment + surplus inventory matching quote. Contact us for personalized advice!
(Author: AMPLE CHIP LIMITED Supply Chain Expert Team, December 2025)